|
|
|
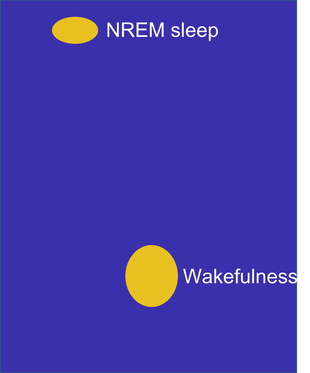
I tried different ways of looking at transitions between NREM sleep and wakefulness. Here, each dot in the video is an EEG channel - the brain waves recorded at different locations on a sheep cortex.
The large dots are the frontal channels, the smallest dots are the occipital channels. Red dots are right side, green are left.
The heatmap space corresponds to frequency ratios of the EEG, whereby the top left frequencies are observed when a sheep is in NREM sleep, and the larger bottom right area is wakefulness. As the video plays, the dots dance around - at each time point the frequencies present in the EEG are changing. I wanted to see whether I could find patterns in how the channels entered and exited sleep - though this specific work went no further than these initial explorations (so please forgive the lack of axis labels, but see here for better technical description of the frequency ratios used). Each second in the video corresponds to a 10 second epoch.
